The Ethereum price reached a local low at around $ 1,524 and then rose to the 0.382 Fib resistance at around $ 1,717, whereupon ETH was rejected bearishly.
In the last Ethereum price forecast, we wrote“”The Ethereum price has broken out of the parallel upward channel bearishly and is therefore on the verge of reaching the important support between 1.590 and 1.653 USD. Ethereum could bounce very strongly there.”
Ethereum price falls to around 1.524 USD in the short term
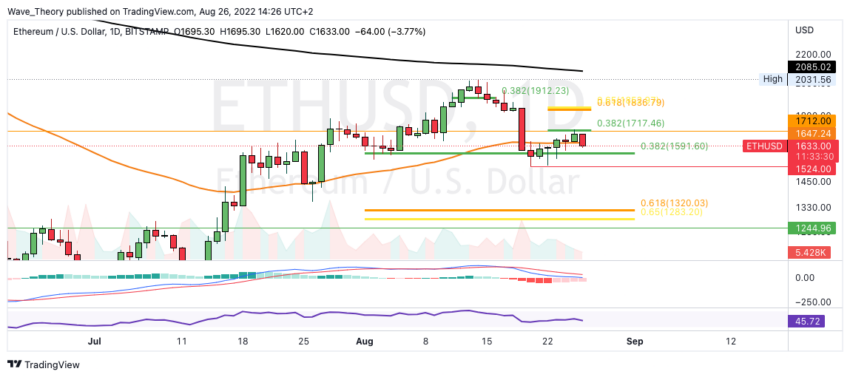
The Ethereum price reached the 0.382 Fib support at around $1,592 and broke it bearish in the short term to establish a local low at around $1,524 USD. Subsequently, however, the Ethereum price was able to rise for a few days and even broke the 50-day EMA bullish. As a result, the ETH price reached the 0.382 Fib resistance at around $ 1,717. However, Ethereum has now been rejected bearishly there.
The Ethereum price could now return to support between $1,524 and $1,592 if the 50-day EMA cannot hold at around $1,647. If Ethereum also breaks this support, the ETH price could correct the golden ratio at around $ 1,300. At the latest, the Ethereum price should be able to bounce very strongly there.
In addition, the MACD’s histogram has been ticking bullish higher for several days, while the MACD lines remain bearishly crossed. The RSI is neural.
The Ethereum price was rejected bearishly at the 0.382 Fib resistance at around 1.717 USD
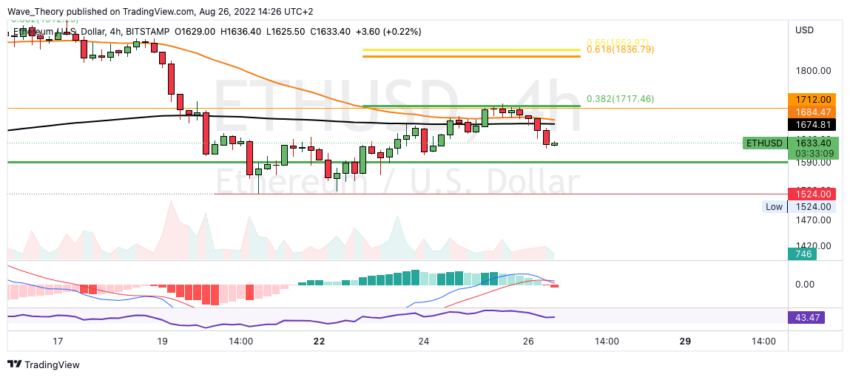
Also in the 4H chart, it initially looks like a continuation of the downward movement. Because the EMAs are on the verge of a death cross and the histogram of the MACD is also ticking bearishly lower, while the MACD lines have crossed bearishly.
The RSI gives neither bullish nor bearish signals.
Ethereum Price Could Close above 200-week EMA this Week
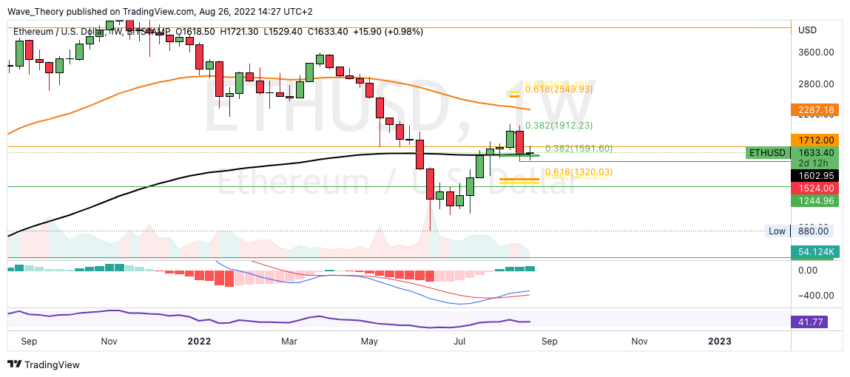
In contrast, the MACD continues to be bullish on the weekly chart. Finally, the MACD’s histogram is still ticking bullish higher and the MACD lines are still crossed bullish.
There is still a chance that Ethereum will close above the 200-week EMA at around $1,603 this week. There is only the weekend left until the weekly candle closes. A weekly close above the 200-week EMA would give bullish hope.
Then Ethereum could make another attempt to break the 0.382 Fib resistance at around $1,717. However, only when Ethereum breaks the golden Ratio at around $ 1,850, the correction is over.
Will the ETH price close above the 50-month EMA this month?
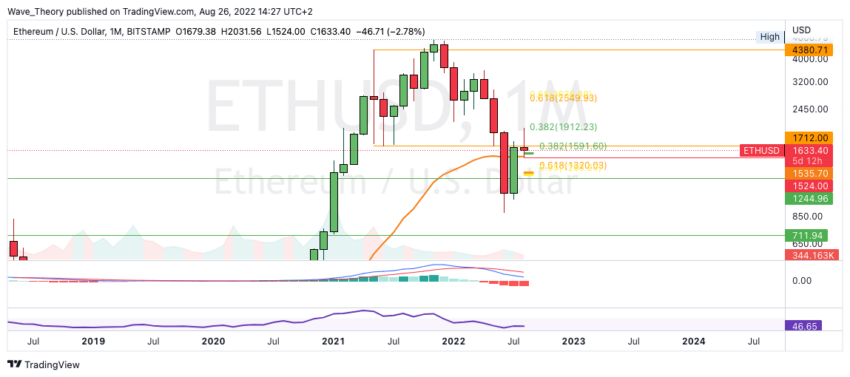
The monthly candle also closes in a few days. Ethereum should definitely close above the 50-month EMA at around $ 1,535 in order not to lose the bullish momentum. Otherwise, Ethereum is expected to correct to Golden Ratio support at around $1,300.
In addition, the MACD is still bearish on the monthly chart, while the RSI is neutral.
Against BTC, the ETH price is still at Golden Ratio resistance
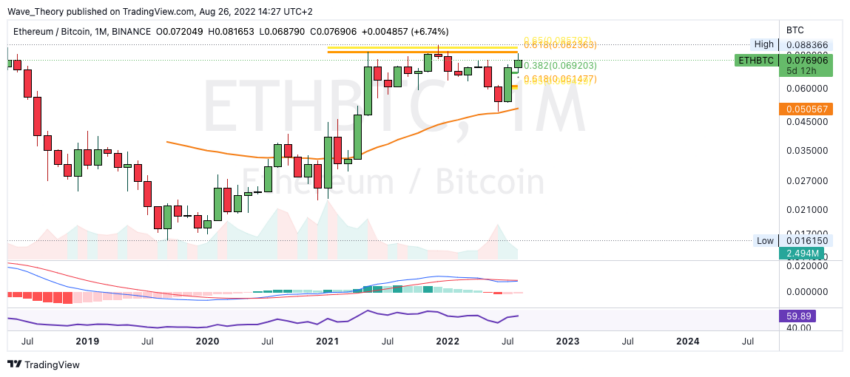
Against BTC, the histogram of the MACD ticks bullish higher in the monthly chart, while the MACD lines are still bearishly crossed. Ethereum is currently encountering golden Ratio resistance and Ethereum could now be rejected again at the Golden Ratio resistance at around 0.085 BTC. Then Ethereum will already find the next significant Fibonacci supports at around 0.069 BTC and at around 0.061 BTC.
Disclaimer
All information contained on our website is researched to the best of our knowledge and belief. The journalistic articles are for general information purposes only. Any action taken by the reader on the basis of the information found on our website is done exclusively at his own risk.