The S&P 500 price was strongly bearishly rejected 0.58% below the Golden Ratio resistance, leaving the bearish trend line intact.
In the last S&P 500 price forecast we wrote“”So the SPX price still has an upside potential of around 2% until it encounters strong resistance at around 4,350. If the S&P500 is rejected there, it will find significant Fibonacci support at around 4,100 and 3,900.“
The S&P 500 price rose to 4,325 and then fell sharply
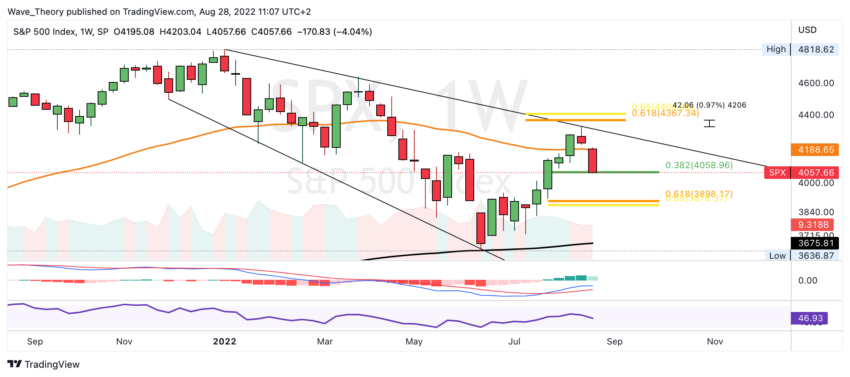
The S&P 500 price rose to 4,325, missing the Golden Ratio price target by 0.58%. This was followed by the strong bearish rejection, which means that the SPX price is now at the 0.382 Fib support at around 4,060. There, the SPX price could now bounce off to rise to the 50-week EMA at around $ 4,190. After all, the MACD lines in the weekly chart are still crossed bullish, while the RSI is neutral.
However, the MACD’s histogram is already ticking bearishly lower this week and the week will close in a few hours. If the SPX price breaks the 0.382 Fib support at around 4,060 bearish, the S&P 500 price could fall to around 3,900. This is where SPX encounters significant Fibonacci support.
MACD’s Monthly Histogram is Ticking Bearishly Lower again
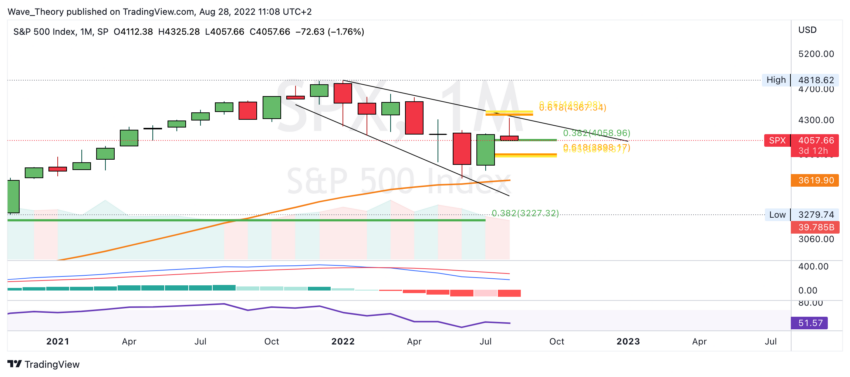
There are only a few days left until the monthly candle closes. The MACD’s histogram is ticking bearishly lower this month, while the MACD lines remain bearishly crossed.
Should de Fibonacci be unable to maintain supports at around 3,900 and 4,060, the SPX price could correct for the 50-month EMA at around 3,620.
Also in the daily chart it looks bearish for the S&P 500 price
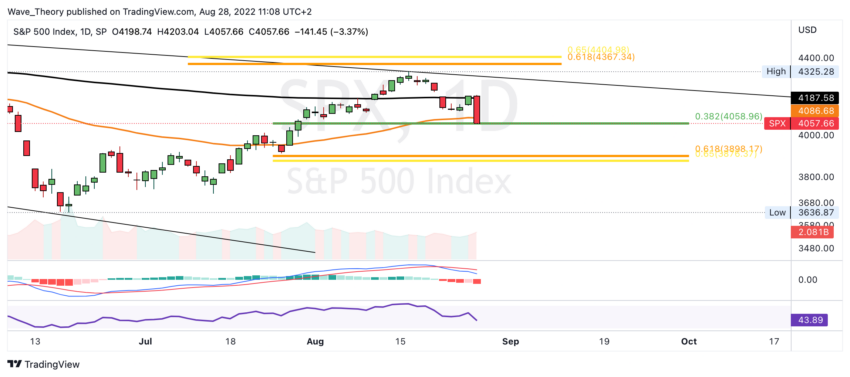
Also in the daily chart, the indicators do not give bullish signals. Thus, the RSI is neutral, while the histogram of the MACD ticks bearishly lower and the MACD lines remain bearishly crossed. In addition, the death cross of the EMAs is intact, which confirms the bearish trend in the short to medium term.
SPX price shows parallels to the BTC price
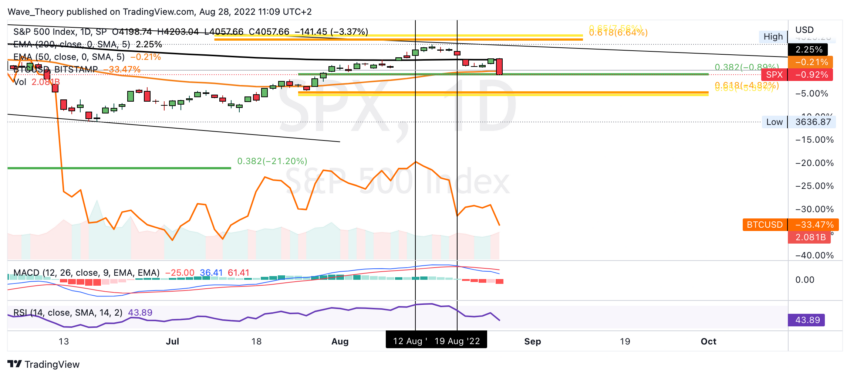
Currently, the Bitcoin price seems to be forming an extreme point a few days before or after the SPX price. Thus, both the S&P 500 price and the BTC price are currently in a downward movement.
Disclaimer
All information contained on our website is researched to the best of our knowledge and belief. The journalistic articles are for general information purposes only. Any action taken by the reader on the basis of the information found on our website is done exclusively at his own risk.