The UNI price fell exactly to the correction target of the Golden Ratio support at around 5.8 USD and bounced back very strongly. What’s next?
UNI Course Forecast: Uniswap breaks Fib Support Bearish
In the last Uniswap course forecast we wrote“ “Should the UNIVERSITY course not break this resistance, could he correct to the Golden Ratio support at around $5.8. However, the histogram of the MACD has been bullish for several days now. However, the MACD lines are still bearishly crossed and the RSI is neutral.”
UNI rate falls exactly to the Golden Ratio at around 5.8 USD
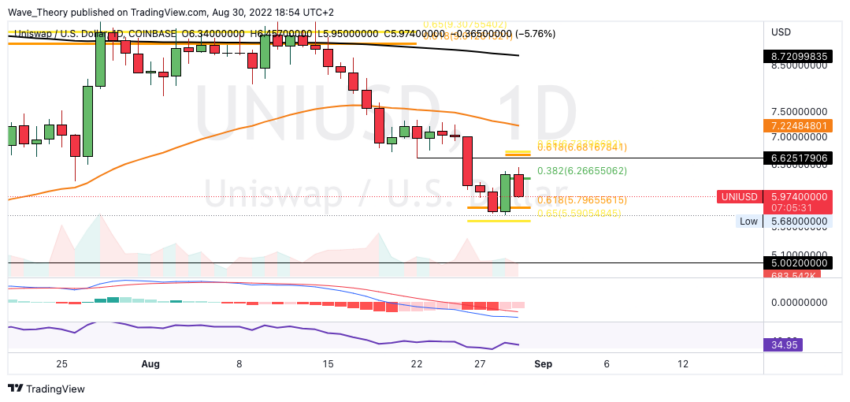
The UNI price fell exactly to the Golden Ratio support at around $ 5.8 and bounced around 14% upwards. Today, however, the UNIVERSITY course is falling very sharply again, thus nullifying yesterday’s increase.
In addition, the MACD lines are bearishly crossed, while the RSI is neutral. But the histogram has been ticking bullish higher since yesterday.
In the 4H chart, the Death Cross confirms the bear trend
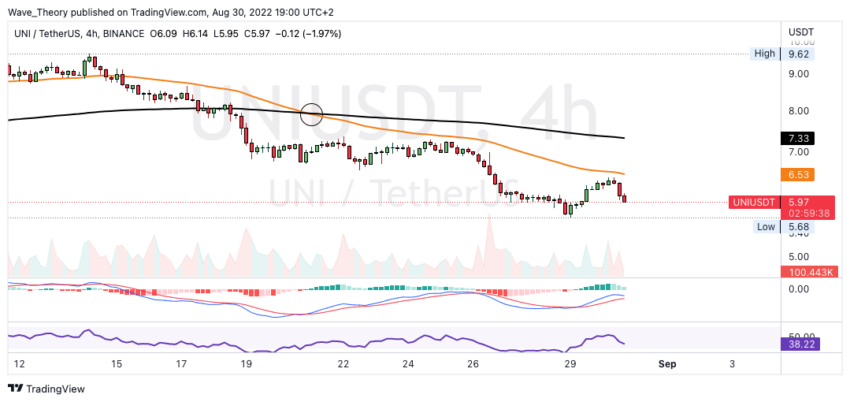
A death cross was established in the 4H chart a few days ago, which confirms the trend bearish in the short term. In addition, the MACD’s histogram is ticking bearishly lower and the MACD lines could soon cross bearishly. The RSI gives neither bullish nor bearish signals.
This is the last chance for the Uniswap course
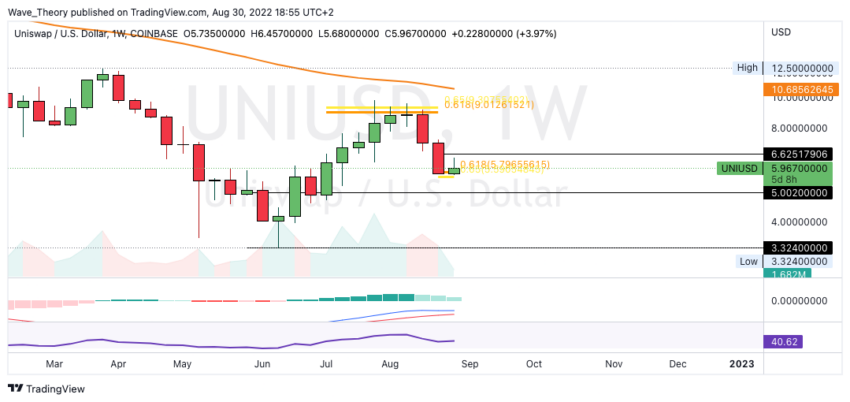
With the Golden Ratio support reaching around $5.8, this is now the last chance for the Uniswap price to maintain the bullish momentum. Because if the UNI price breaks the Golden Ratio support bearishly now, significant support is only waiting for the UNI price again between 3.3 USD and 5 USD.
In addition, the MACD’s histogram is ticking bearishly lower for the third week in a row and the MACD lines could soon cross bearishly.
Is the UNI rate falling back to the low point at around 3.3 USD?
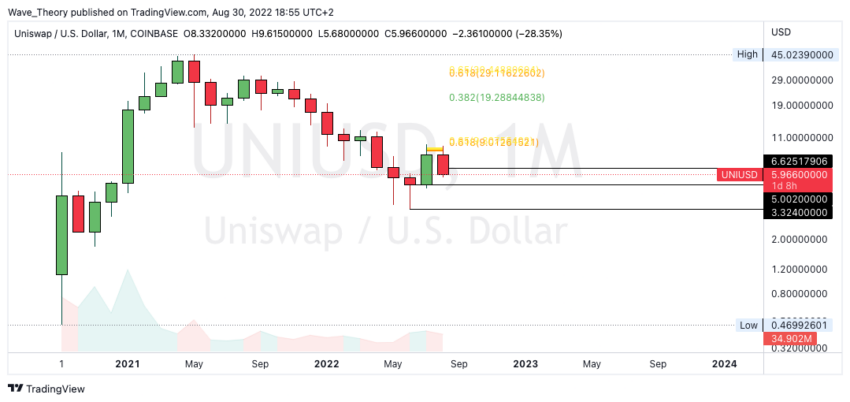
In addition, the bearish rejection at the Golden Ratio resistance at around USD 9 confirms the bear trend. In the medium term, the UNIVERSITY course could therefore correct between 3.3 USD and 5 USD.
The UNI course bounced against BTC on the 200-day EMA
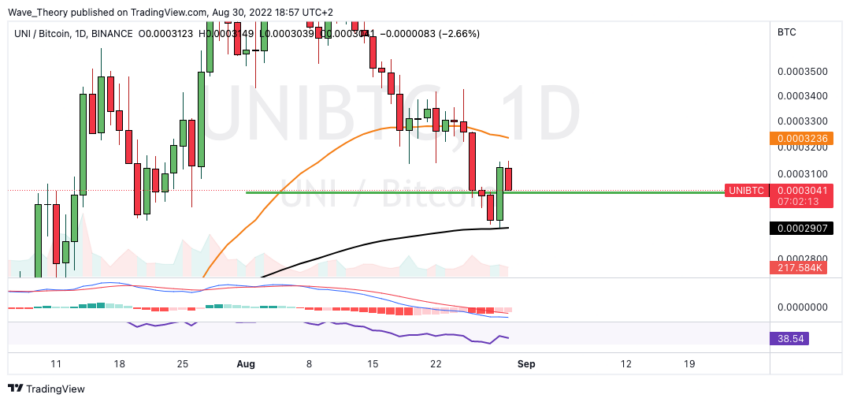
Against BTC, the UNI price fell back exactly to the 200-day EMA at around 0.00029 BTC, against which the UNI price could bounce very strongly. Since yesterday, the MACD’s histogram has also been ticking bullish higher, but the MACD lines have crossed bearishly while the RSI is neutral.
Uniswap was rejected at the 50-4H-EMA resistance
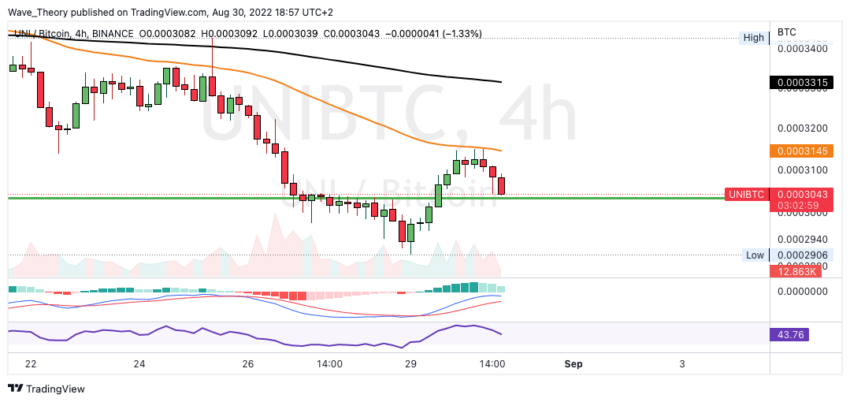
However, the Uniswap price was bearishly rejected a few hours ago at the 50-4H-EMA resistance at around 0.0003145 BTC, which means that the UNI price could now continue its downtrend.
The histogram of the MACD is also ticking bearishly lower in the 4H chart. However, the MACD lines are still crossed bullish.
UNI price could fall to around 0.00024 BTC
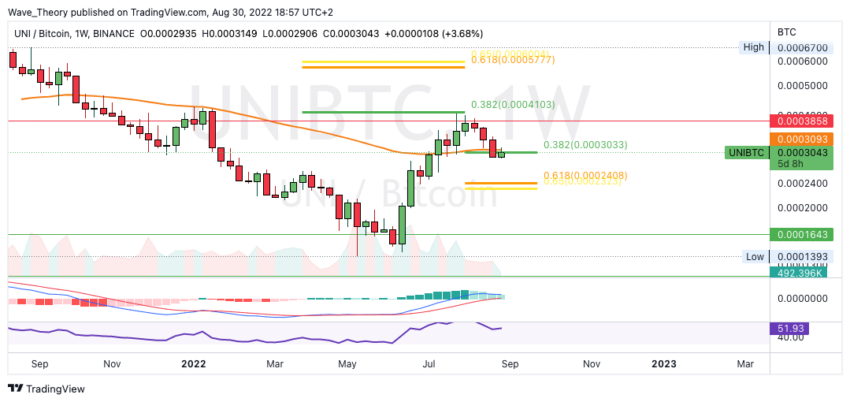
Also in the weekly chart, the histogram of the MACD ticks bearishly lower. Should look if the UNI rate cannot hold above 0.000303 BTC now, the Uniswap rate could soon correct to the Golden Ratio support at around 0.00024 BTC. The UNIVERSITY course could bounce back very strongly there.
However, with the bearish rejection at the 0.382 Fib level at around 0.00041 BTC, the bear trend is also confirmed against BTC.
Disclaimer
All information contained on our website is researched to the best of our knowledge and belief. The journalistic articles are for general information purposes only. Any action taken by the reader on the basis of the information found on our website is done exclusively at his own risk.