The BNB price returned twice to the 0.382 Fib support at around $ 278. But now the Binance Coin could break this support bearishly.
BNB Price Forecast: Binance Coin corrected to Fib level
In the last BNB price forecast, we wrote: “After the BNB price was rejected at around USD 326 on the 200-day EMA, the BNB price corrected exactly to the 0.382 Fib level at around USD 278 and bounced back very strongly. In the course of this, the BNB Course the 50-day EMA is bullish at around $289 and reached the 0.382 Fib level at the $ 300 mark, where the BNB price has been bearishly rejected in recent days.“
The BNB course was held on Fib Level at around 300 USD strongly rejected
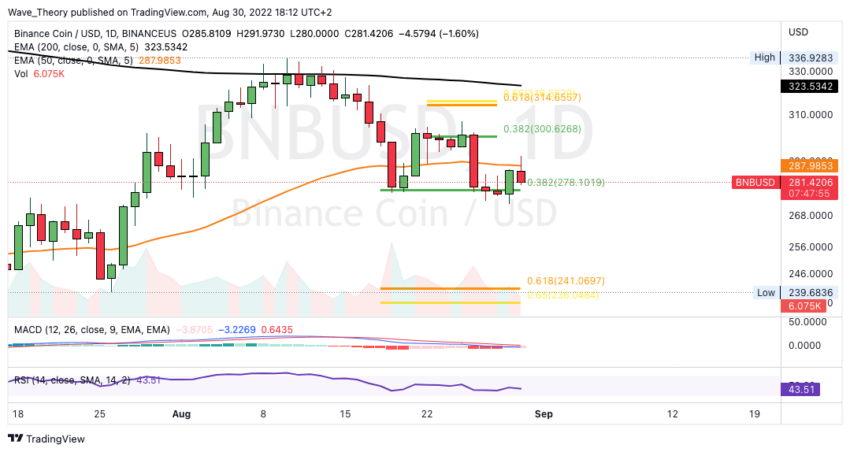
The BNB price could not break the 0.382 Fib resistance at around $ 300, but was rejected very strongly bearish. Subsequently, the BNB price returned from around 300 USD to around 278 USD in just one day, where the BNB price was able to bounce off the 0.382 Fib support at around 278 USD again.
The BNB price reached the 50-day EMA at around 288 USD, which BNB is apparently being rejected bearishly today. This would allow BNB to return to the 0.382 Fib support at around USD 278 and if this is broken bearishly, BNB will only find significant Fib support again at around USD 240.
In addition, the MACD lines in the daily chart are bearishly crossed, while the RSI is neutral. The histogram has been ticking bullish higher for two days.
MACD’s Weekly histogram weakens
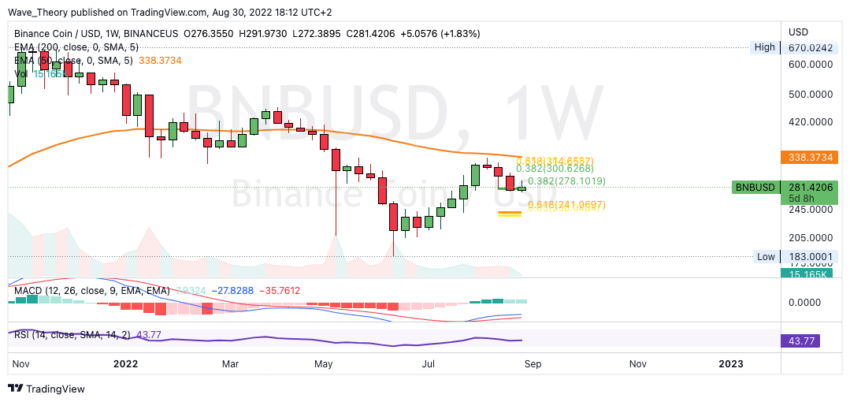
On the weekly chart, the MACD’s histogram has been ticking bearishly lower since last week. However, the MACD lines are still crossed bullish and the RSI is neutral. Overall, BNB is still very bearish, because BNB could not break the 50-week EMA at around USD 340 and thus did not even reach the important golden Ratio resistance at around USD 360.
In order for BNB not to lose the bullish momentum of the last eleven weeks, BNB should bounce strongly now or at the latest at around USD 240 to continue the upward movement.
Is the BNB price falling back to the low point at around 183 USD?
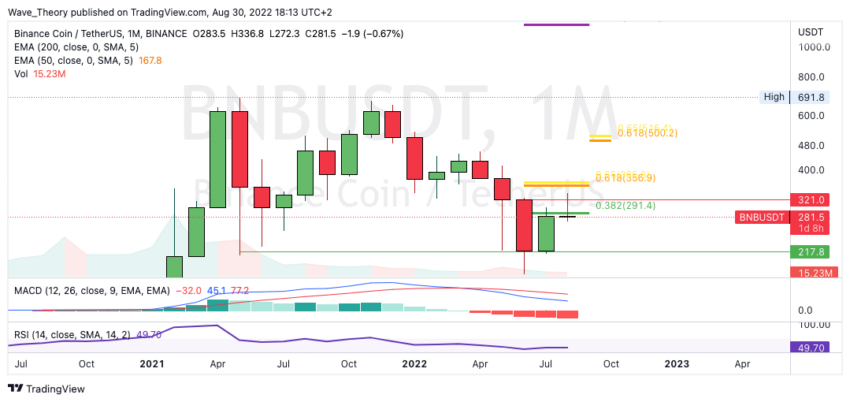
Otherwise, the Binance Coin price could again return to the local low at around $ 183. Because if BNB breaks the Golden Ratio support at around 240 USD, it will only wait between around 183 USD and 218 USD significant support on BNB.
In addition, the MACD continues to be clearly bearish on the monthly chart, because the MACD’s histogram is ticking bearishly lower and the MACD lines are crossed bearishly.
Against BTC, the RSI forms a bearish divergence in the daily chart
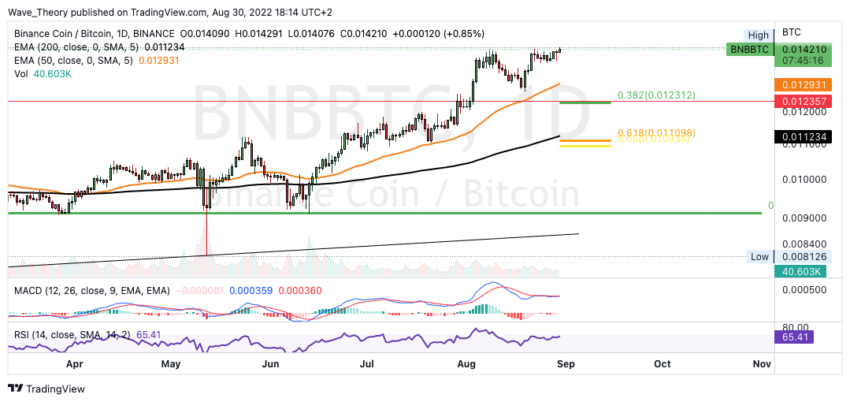
Against BTC, the BNB price is still on an ATH. In fact, he has even surpassed the recently established ATH. Jhowever, there is a strong bearish divergence in the RSI on the daily chart. As a result, the BNB price could soon return to the 0.382 Fib support at around 0.012312 BTC, or even to the Golden Ratio support at around 0.0111 BTC.
Disclaimer
All information contained on our website is researched to the best of our knowledge and belief. The journalistic articles are for general information purposes only. Any action taken by the reader on the basis of the information found on our website is done exclusively at his own risk.