The Polkadot price returned to the Golden Ratio support at around $ 7.4, which the DOT price was able to bounce off at first.
In the last Polkadot course forecast we wrote“ “The Polkadot rate could now correct to $ 7.4. If the DOT price breaks the current support between 8.25 and 8.4 USD bearish, the next significant Fibonacci support is waiting for Polkadot at around 7.4 USD. Although it looks like a correction in the short termhowever, the DOT price is still strongly bullish in the medium term.”
Polkadot price corrected to Golden Ratio support at around $7.4
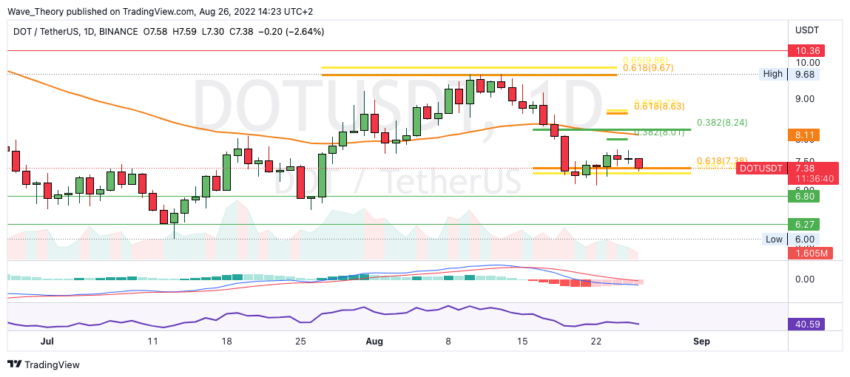
After the Polkadot price was rejected bearishly at the Golden Ratio resistance at around 9.7 USD, the DOT price returned to the Golden Ratio support at around $ 7.4, which DOT was initially able to bounce off bullish. However, finished DOT the upward movement without reaching the 0.382 Fib resistance at around $ 8 and this is again at the Golden Ratio support at around 7.4 USD.
There, the DOT price could now bounce again to reach the 0.382 Fib resistance at around $ 8. In addition, there is significant resistance at the 50-day EMA at around USD 8.11. Furthermore, the DOT price has to break the golden ratio at around $ 8.7 to end the correction.
In addition, the histogram of the MACD has been ticking bullish higher for several days and despite the last three bearish days, the histogram continues to tick bullish higher. The upward movement could therefore be continued soon.
A death cross was established in the 4H chart
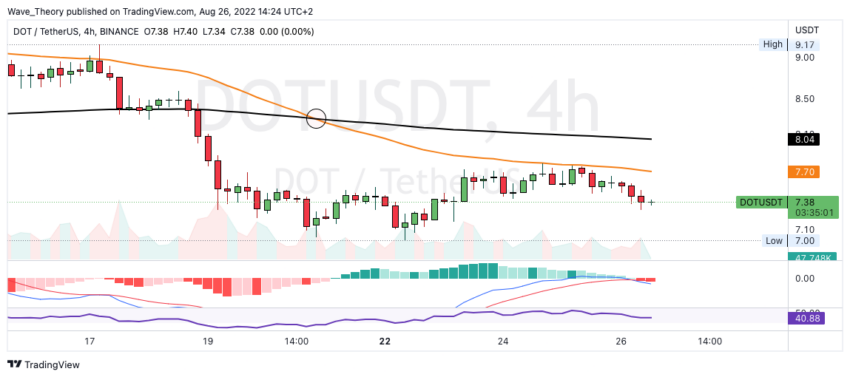
The 4H chart, on the other hand, is bearish. On the one hand, the MACD lines are bearishly crossed and the histogram of the MACD ticks bearishly lower. On the other hand, a death cross was established, which confirms the bearish trend in the short term.
In addition, the 4H chart shows why the Polkadot price could not reach the 0.382 Fib resistance at around USD 8. Because the DOT price was already rejected bearishly at around $ 7.7 on the 50-4H EMA.
When the Golden Ratio support breaks at around $7.4…
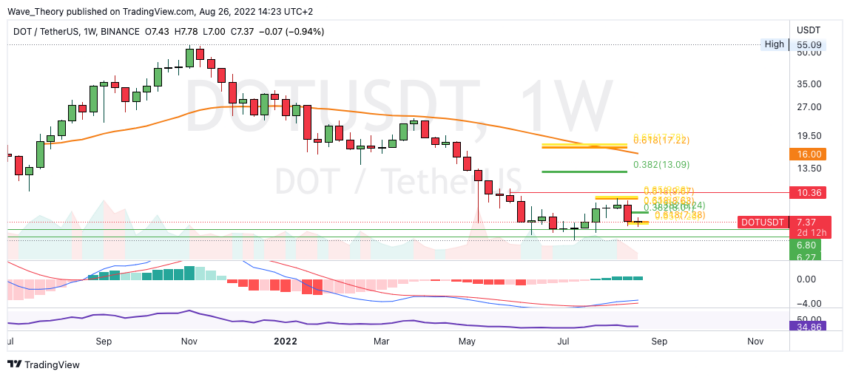
If the Polkadot price breaks the Golden Ratio support at around $ 7.4, the DOT price could return to the last low at around $ 6. Because only between 6 USD and 6.8 USD Polkadot will then find support again.
In the weekly chart, however, the MACD is clearly bullish, because the MACD lines are crossed bullish and the histogram has been ticking bullish higher for a few weeks. The RSI is neutral.
Polkadot price could even fall to around 3.5 USD
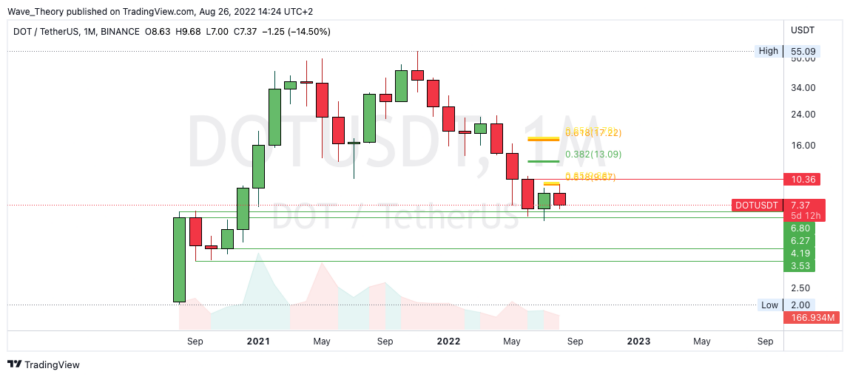
If Polkadot itself breaks the support between $ 6 and $ 6.8 bearish, significant support will wait for the DOT price again between $ 3.5 and $ 4.2.
Against BTC, Polkadot was rejected bearishly on the 200-day EMA
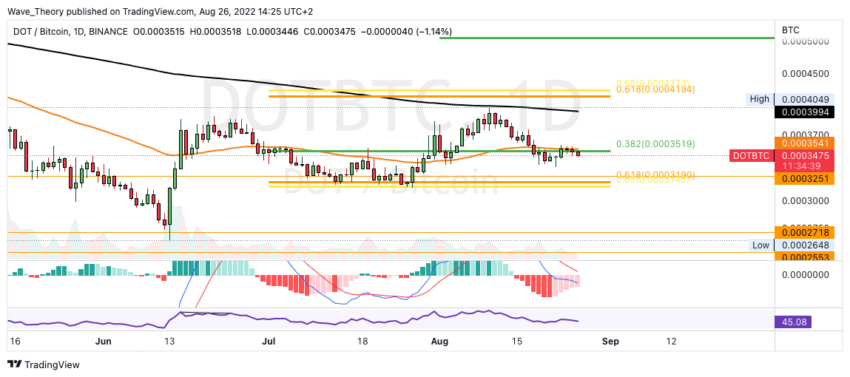
Against BTC, the Polkadot price was bearishly rejected at around 0.0004 BTC on the 200-day EMA. The DOT price is currently at the 0.382 Fib support at around 0.00035 BTC and if this is broken bearishly, DOT will find the next support at around 0.000315 BTC.
In addition, the MACD lines in the daily chart are bearishly crossed and the EMAs are in a death cross. The histogram, on the other hand, has been ticking bullish higher for a few days.
Disclaimer
All information contained on our website is researched to the best of our knowledge and belief. The journalistic articles are for general information purposes only. Any action taken by the reader on the basis of the information found on our website is done exclusively at his own risk.