The UNI price is approaching the 0.382 Fib support against BTC, whereas UNI has already broken this support bearishly on the USD chart.
In the last UNI course forecast, we wrote“ “The UNI course has now been rejected bearishly at the Golden Ratio resistance at the 200-day EMA at around USD 9, which UNI could now correct with. In addition, the histogram of the MACD has been ticking bearishly lower in the daily chart for several days and the MACD lines have also crossed bearishly. The RSI is neutral.
The UNI rate could now correct between around 7.3 and 7.6 USD, because there it meets 0.382 Fib support and the 50-day EMA.
UNI price broke support between 7.3 and 7.6 USD bearish
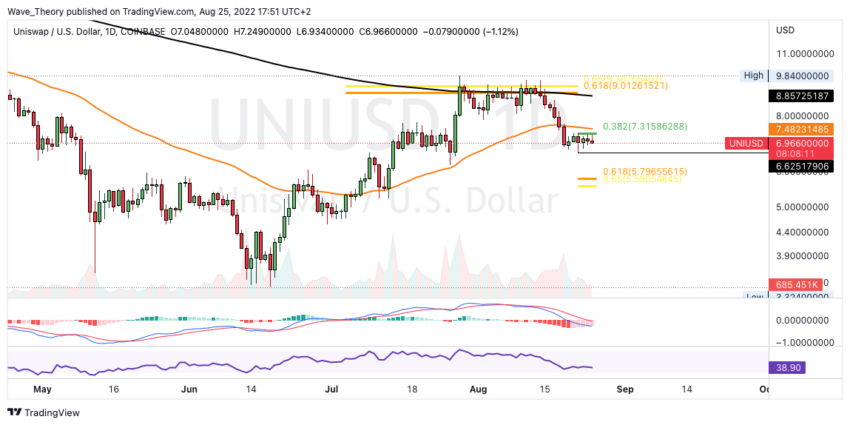
The UNI price initially fell to the 50-day EMA, but broke the 50-day EMA support and the 0.382 Fib level between $7.3 and $7.6 bearish the next day. In the course of this, the UNIVERSITY price fell to around 6.6 USD and initially bounced off it to rise to the 0.382 Fib level at around 7.3 USD. There, however, the UNIVERSITY course was rejected several times.
If the UNI rate does not break this resistance, it could correct to the Golden Ratio support at around $ 5.8. However, the histogram of the MACD has been bullish for several days now. However, the MACD lines are still bearishly crossed and the RSI is neutral.
Death Cross in the 4H chart confirms the trend bearish in the short term
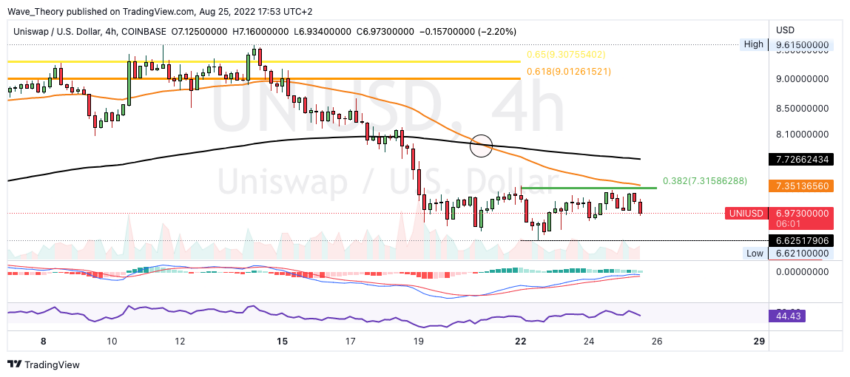
A death cross was established in the 4H chart, which confirms the trend bearish in the short term. In addition, the histogram of the MACD is also ticking bearishly lower and the MACD lines could soon cross bearishly.
The 0.382 Fib resistance at around 7.3 USD seems to be an insurmountable obstacle for the UNI course at first. If the UNI price breaks this resistance bullish, the next significant Fibonacci resistances are waiting at around 7.8 USD and 8.7 USD.
MACD’s Weekly Histogram starts to weaken
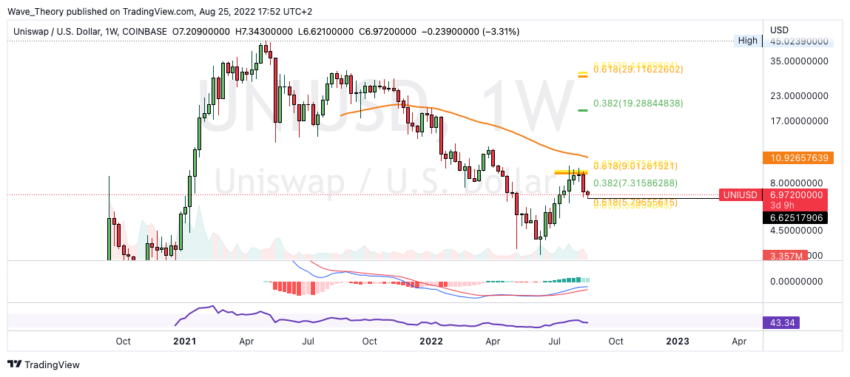
The weekly MACD gives the first bearish signs, because the histogram of the MACD has been ticking bearishly lower since last week. However, the MACD lines are still crossed bullish and the RSI is neutral.
Should Uniswap bounce off the golden Ratio at around USD 5.8 at the latest, the decisive resistance will be around USD 9. If UNI breaks the Golden Ratio at around $9, UNI could target the 50-day EMA at around $11. Subsequently, Uniswap could even rise to the 0.382 Fib level at around USD 19.3.
What happens if the Uniswap price breaks the Golden Ratio support bearishly?
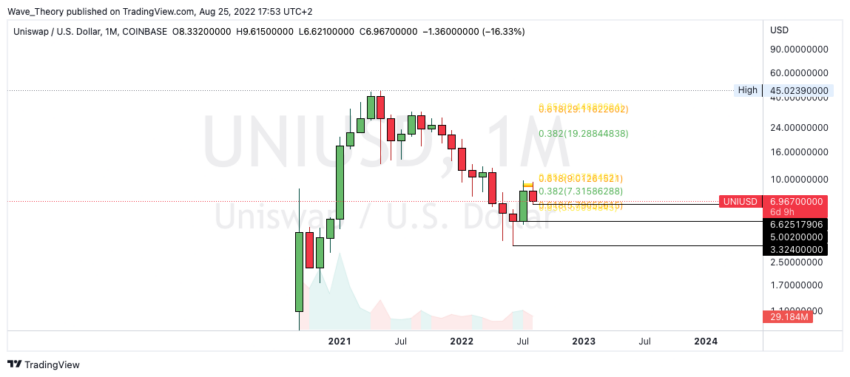
If the Uniswap price breaks the Golden Ratio support at around $ 5.8 bearish, significant support will wait for the UNI price between $ 3.3 and $ 5 again.
For a bullish trend reversal, the UNI course must break the Golden Ratio at the 30 USD mark.
UNI courses on the way to 0.382 Fib support
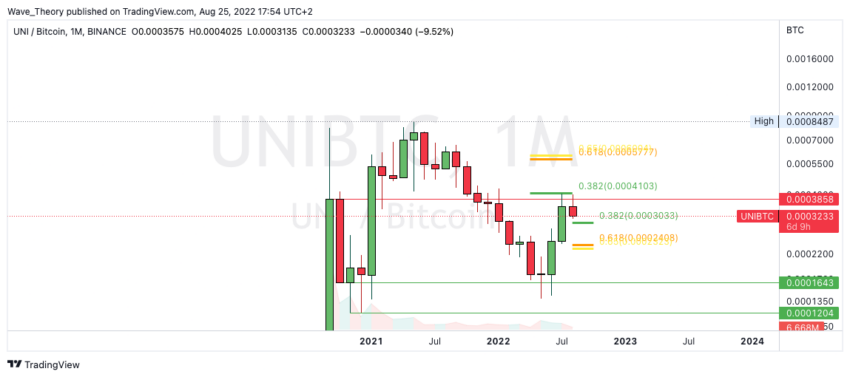
Not much has changed against BTC since the last UNI price forecast: “In fact, the Uniswap price has now been rejected bearishly at the 0.382 Fib resistance at around 0.00041 BTC. With this, UNI could now correct to the 0.382 Fib support at around 0.0003 BTC or even to the golden Ratio at around 0.00024 BTC.“
The UNI course is approaching the 0.382 Fib support at around 0.0003 BTC. There, or at the latest at the golden ratio at around 0.00024 BTC, the UNIVERSITY price could bounce very strongly upwards.
Disclaimer
All information contained on our website is researched to the best of our knowledge and belief. The journalistic articles are for general information purposes only. Any action taken by the reader on the basis of the information found on our website is done exclusively at his own risk.