The Bitcoin price is currently at strong support between $ 13,880 and $ 19,666. Will the Bitcoin price bounce now or fall even lower?
Bitcoin Price Forecast: Will we see a new low soon?
In the last Bitcoin price forecast, we wrote“”In the daily chart, there is still bullish hope for the Bitcoin price. Finally can Bitcoin despite the violent crash from around $ 25,200 to $ 20,750, a higher low point is forming and thus maintaining the series at higher lows and highs. In addition, the histogram of the MACD begins to tick bullish higher in the daily chart.
However, the MACD lines are crossed bearishly and the RSI gives neither bullish nor bearish signals. In order for the series to be maintained at higher high points, Bitcoin must now break the Fib resistances at around $ 22,450 and $ 23,500. In addition, the 50-day EMA resistance is around $23,000 in between.“
The Bitcoin price has breached the Golden Ratio support at around $ 20,500 bearishly
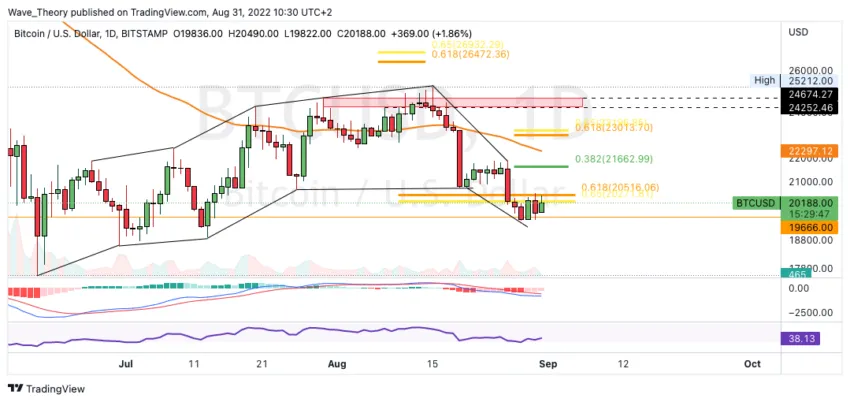
The Bitcoin price only rose to around $ 21,900 after reaching a higher low at around $ 20,750. Subsequently, the BTC price continued the downward movement and broke the Golden Ratio support at around $ 20,500 bearish. With this, Bitcoin returned to the upper end of the horizontal support between around $ 14,000 and $ 20,000, against which BTC was initially able to bounce. With this, BTC formed a lower high point and a lower low point.
Bitcoin needs to overcome the golden Ratio at around $23,000 to end the correction. However, significant Fib resistance is already waiting for BTC at around $21,663. In addition, the 50-day EMA acts as a significant resistance at around $ 22,300.
The MACD lines are still bearishly crossed, but the histogram has been ticking bullish higher for a few days. The RSI is neutral. Basically, Bitcoin could rise in the short term to the next resistance at around $ 21,663. However, without a break in the golden Ratio at around $ 23,000, Bitcoin may penetrate even deeper into the support zone between around $ 14,000 and around $ 20,000.
In the 4H chart, the Death Cross confirms the bear trend
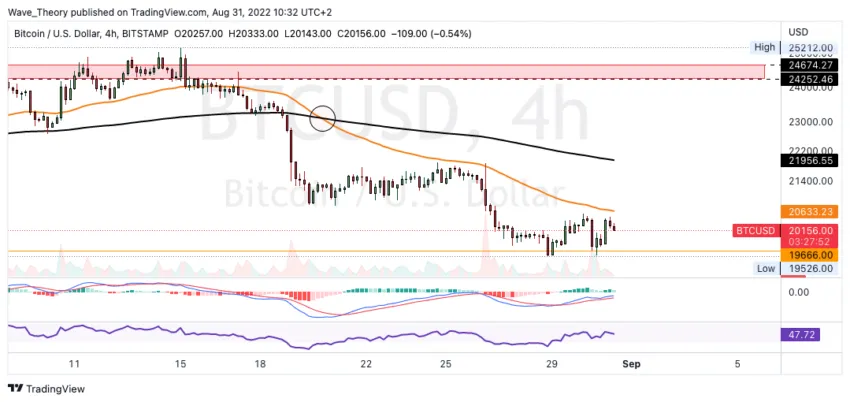
Im 4H chart established a death cross, which confirms the trend bearish in the short term. In addition, the BTC price has so far bounced twice on the support at 19.666 USD, but could not even overcome the 50-4H EMA at around 20.633 USD.
The MACD gives rather bullish signals, because the MACD lines are crossed bullish, while the histogram alternately ticks bullish higher and bearish lower.
Weekly MACD still gives Bullish signals
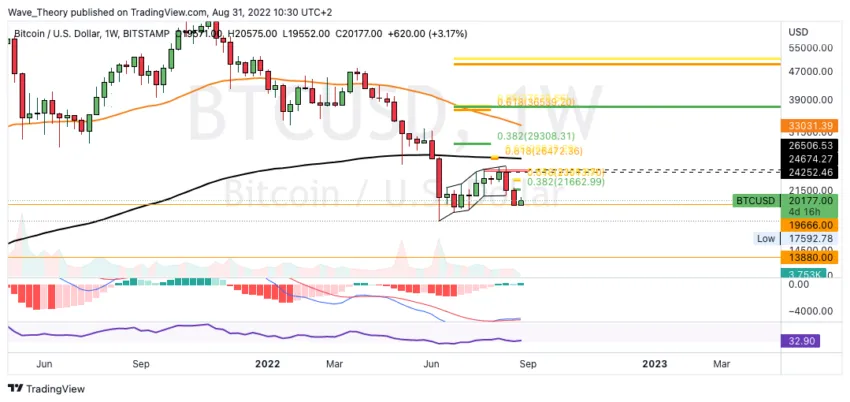
On the weekly chart, the MACD’s histogram ticked bearishly lower last week for the first time in a few weeks. This week, however, it is starting to tick bullish higher again. The MACD lines are still crossed bullish, while the RSI is neutral.
Will the Bitcoin price fall to $ 13,880?
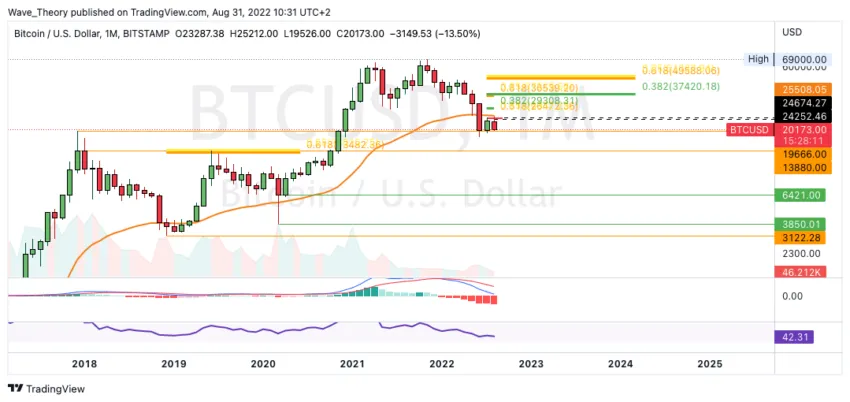
Overall, the current month of August ends much more bearish than it initially began. Den the BTC price actually had the chance of a bullish trend reversal this month. Instead, it now looks like a continuation of the downtrend, with a potential bottom at around $13,880.
So Bitcoin could settle between $ 13,880 and $ 19,666 in the medium term. On the other hand, if BTC breaks this support bearishly, Bitcoin could even fall between $ 3,850 and $6,421.
In addition, the MACD is still clearly bearish on the monthly chart, because the histogram ticks bearishly lower and the MACD lines remain bearishly crossed.
The crypto market has now reached the Golden Ratio support
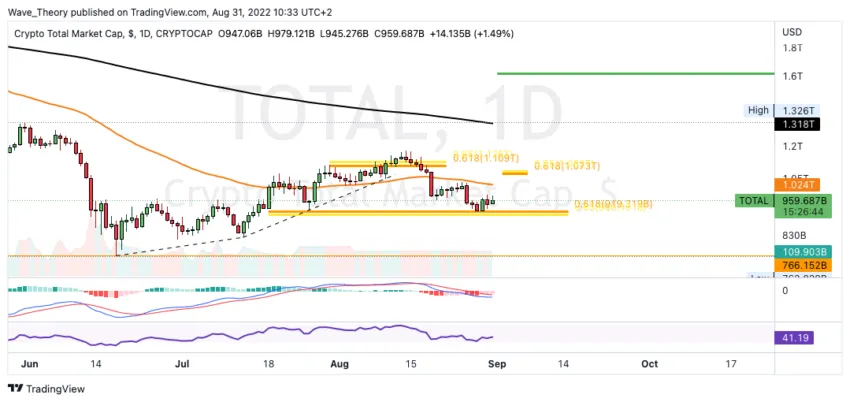
The crypto market initially broke the Golden Ratio resistance at around $1.1 trillion bullish. However, this was a false outbreak, after which the crypto market began to fall sharply. At the Golden Ratio, the crypto market found significant support at around USD 920 billion, which the crypto market was able to bounce off.
To end the correction, the crypto market now needs to break the Golden Ratio resistance at around $1.075 trillion bullish. Otherwise, it could return to the local low point at around $ 766 billion.
Disclaimer
All information contained on our website is researched to the best of our knowledge and belief. The journalistic articles are for general information purposes only. Any action taken by the reader on the basis of the information found on our website is done exclusively at his own risk.