The Chainlink price returned to around $ 6.2. There he encounters strong support, which he has already been able to bounce off several times.
Chainlink price bounces back to $6.2
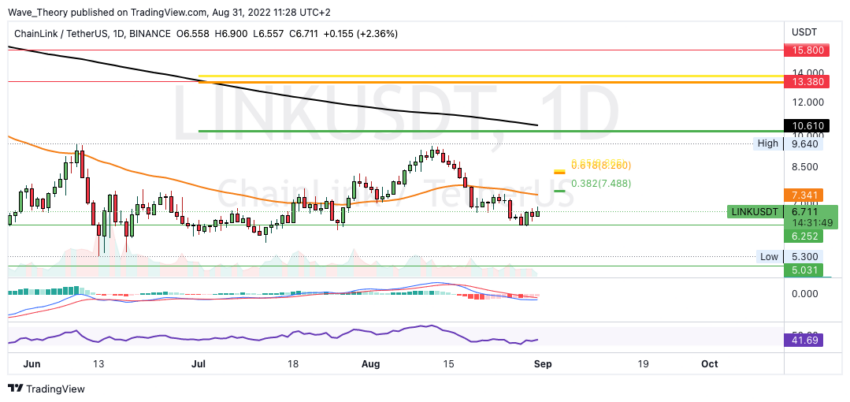
The Chainlink price again returned to support between around $ 5 and around $6.25, which Chainlink was able to bounce off. Thus, Chainlink now finds the next significant Fibonacci resistances at around $ 7.5 and $ 8.3. Without a break in the Golden Ratio resistance at around $ 8.3, the correction remains intact.
In addition, there is already significant resistance at the 50-day EMA at around USD 7.34. In addition, the MACD’s histogram has been ticking bullish higher for a few days now. However, the MACD lines remain bearishly crossed and the RSI is neutral.
The death cross in the 4H chart confirms the trend bearish in the short term
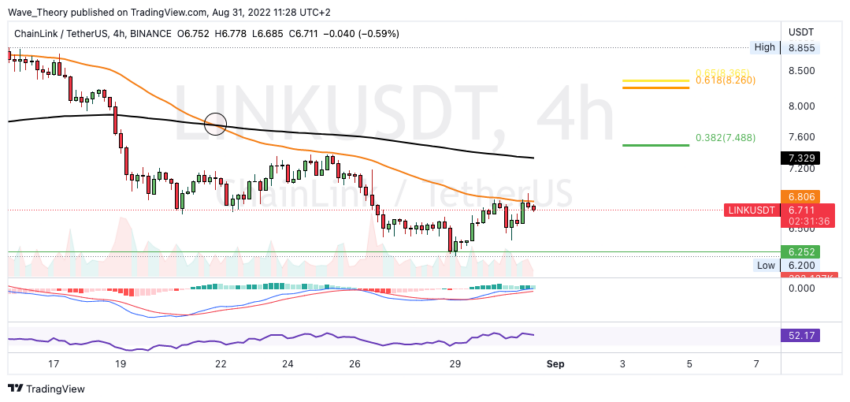
A death cross was established in the 4H chart, which confirms the trend bearish in the short term. In addition, the Chainlink price now seems to be rejected bearishly for a second time at the 50-4H EMA resistance at around $ 6.8.
The MACD lines are crossed bullish in the 4H chart, but the histogram is already ticking bearishly lower. Should the LINK price nevertheless break the 50-4H EMA bullish at around $ 6.8 now, the next significant Fib resistance is waiting at around $ 7.5.
Will the Chainlink price return to the low point at around $ 5.3?
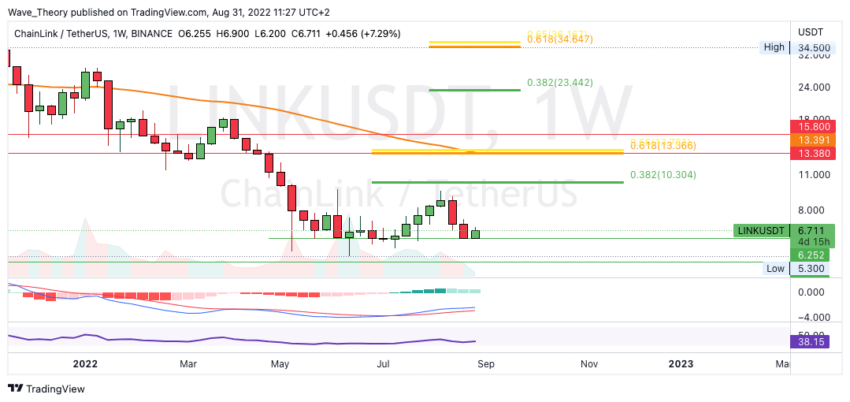
If the LINK price cannot break the golden Ratio at around USD 8.3 bullish, the LINK price could return to the last low at around USD 5.3 in the medium term.
In addition, the MACD’s histogram is ticking bearishly lower on the weekly chart for the third week in a row. However, the MACD lines are still crossed bullish and the RSI is neutral.
If the LINK price breaks the Golden Ratio bullish at around 8.3 USD, the next significant resistances are waiting at around 10.3 USD and 13.4 USD.
The trend remains clearly bearish
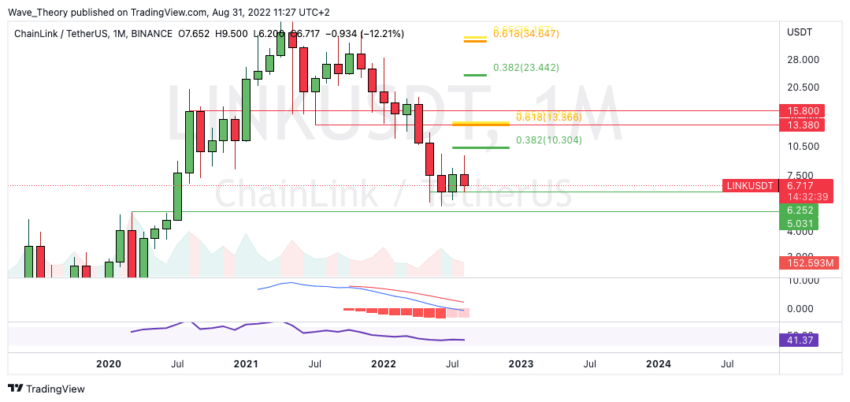
Otherwise, there is no bullish trend confirmation for Chainlink. Only the histogram of the MACD was able to close last month with a bullish higher-ticking. It could also close bullish this month, because there are only a few hours left until the monthly candle closes.
Nevertheless, August was very bearish towards the end. The trend remains bearish until the LINK price overcomes the golden Ratio at around 35 USD.
Against BTC, the Chainlink price was rejected bearishly on the 50-week EMA
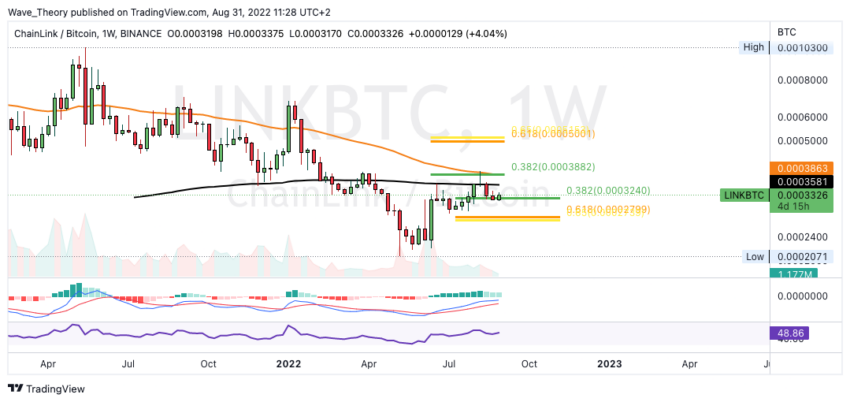
Against BTC, the Chainlink price was rejected bearishly at the 50-week EMA at around 0.000386 BTC, which also leads to the 0.382 Fib level. Thus, the LINK price is now at 0.382 Fib support at around 0.000324 BTC. If LINK breaks this support, significant Fib support will only wait again at around 0.00028 BTC.
Otherwise, the MACD lines in the weekly chart are still crossed bullish, while the histogram is ticking bearishly lower for the third week in a row.
Disclaimer
All information contained on our website is researched to the best of our knowledge and belief. The journalistic articles are for general information purposes only. Any action taken by the reader on the basis of the information found on our website is done exclusively at his own risk.