The BNB rate is perfectly corrected to the Fib level at around 278 USD. Will the Binance Coin price end the correction now?
In the last BNB price forecast, we wrote: “The BNB price could not overcome the 200-day EMA resistance at around $ 330 and thus did not reach the Golden Ratio resistance at around $ 360. In addition, BNB thus returned to the parallel upward channel, the lower end of which crosses the 0.382 Fib level at around USD 278.
Between 278 and 290 USD, the BNB price encounters significant Fibonacci support. In addition, the 50-day EMA runs in between, which also serves as support. If the BNB price now falls back to this support, this implies a downside potential of around 9%.
Although it looks like a correction in the short term, the BNB price could bounce strongly against the correction target in order to make another attempt to reach the golden Ratio at around $ 360. If BNB cannot bounce between 278 and 290 USD, the Binance Coin will find significant Fibonacci support at around 240 USD at the latest.”
BNB price corrected exactly to the 0.382 Fib level
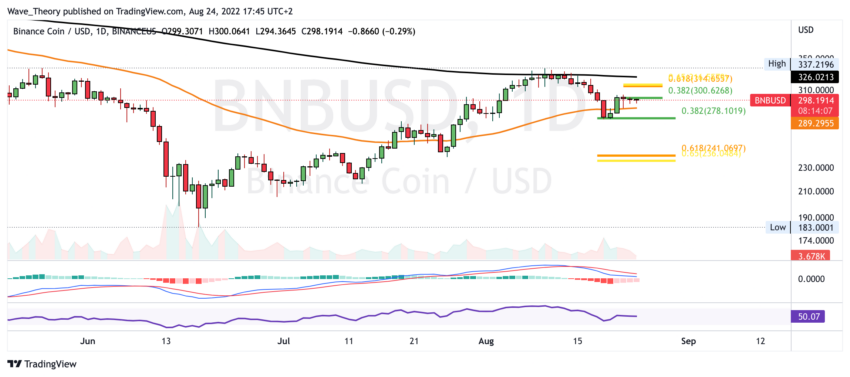
After the BNB price was rejected at around USD 326 on the 200-day EMA, the BNB price corrected exactly to the 0.382 Fib level at around USD 278 and bounced back very strongly. In the course of this, the BNB Course the 50-day EMA is bullish at around $289 and reached the 0.382 Fib level at the $ 300 mark, where the BNB price has been bearishly rejected in recent days.
If the BNB price breaks this Fib resistance, it could rise to the golden ratio at around 315 USD. Only when the golden Ratio is broken at around $ 315, the correction of BNB is over. Then the BNB price can make another attempt to break the 200-day EMA bullish at around $ 326.
In addition, the histogram of the MACD has been ticking bullish higher on the daily chart for several days. However, the MACD lines are still bearish crossed and the RSI gives neither bullish nor bearish signals.
On the weekly chart, the MACD remains clearly bullish
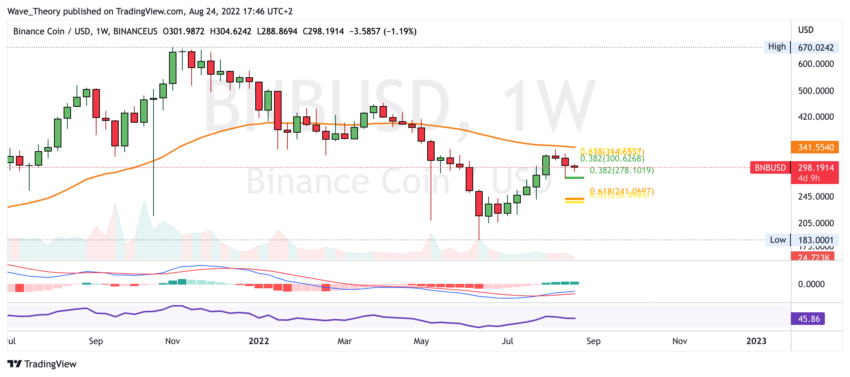
In the weekly chart, the MACD remains clearly bullish, because the histogram ticks bullish higher and the MACD lines remain crossed bullish. However, if BNB cannot break the 0.382 Fib resistance at around $300, BNB may return to the 0.382 Fib support at around $278.
If BNB also breaks this support bearishly, significant Fib support is only waiting for the Binance Coin again at the Golden Ratio at around USD 240.
Monthly closing should be above $ 288, so as not to lose bullish momentum
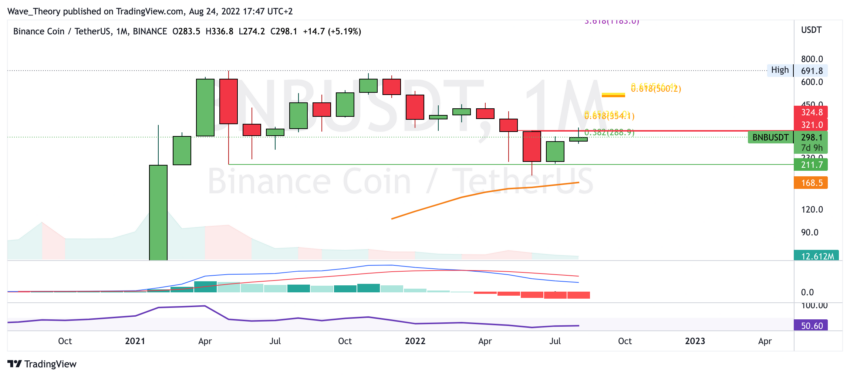
The monthly closing price in about a week should be at least above $ 288 in order not to lose the bullish momentum. This is an important Fib level. In addition, significant Fib resistance is waiting at around $ 360.
In the monthly chart, the MACD remains clearly bearish, because the histogram of the MACD ticks bearishly lower and the MACD lines remain crossed bearishly.
Against BTC, the BNB rate is still on a new ATH
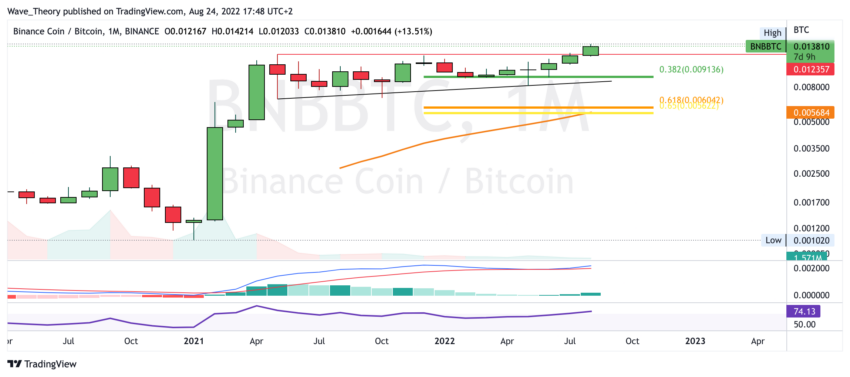
Against BTC, the BNB price is still on the ATH. He finds significant Fibonacci supports at around 0.0091 BTC and 0.006 BTC. However, horizontal Support at around 0.0123 BTC. The MACD is still clearly bullish on the monthly chart, because the histogram is ticking bullish higher and the MACD lines are crossed bullish. The RSI is in oversold regions and could build a bearish divergence.
There are no more horizontal resistances towards the top.
Disclaimer
All information contained on our website is researched to the best of our knowledge and belief. The journalistic articles are for general information purposes only. Any action taken by the reader on the basis of the information found on our website is done exclusively at his own risk.


