The Monero price was almost exactly rejected bearishly at the 200-day EMA at around 172.5 USD, and then bounced off the 0.382 Fib support at around 143.5 USD.
The Monero price was rejected bearishly on the 200-day EMA
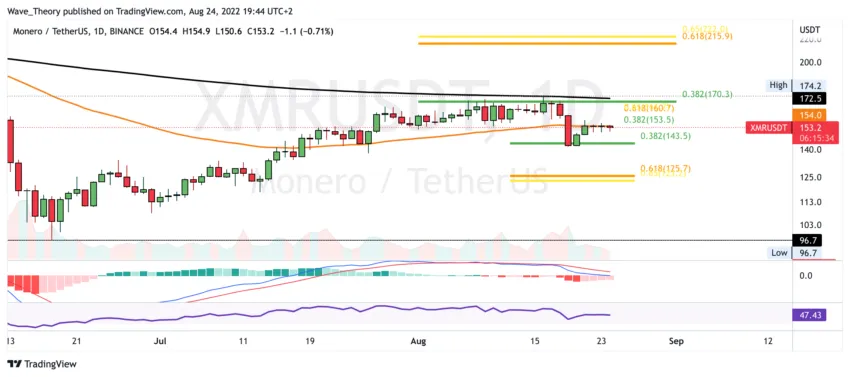
The Monero price has been in an uptrend since mid-June and moved from around 97 USD to around 174.2 USD. Arrived there, the XMR price met significant resistance at the 200-week EMA, whereupon the Monero price was bearishly rejected. Subsequently, the XMR price returned to the 0.382 Fib support at around $143.5 and broke the 50-day EMA bearishly.
Nevertheless, the XMR price was able to bounce very strongly at the 0.382 Fib level at around 143.5 USD. Currently, the XMR price is encountering significant resistance at the 50-day EMA at around $ 154. In addition, significant Fib resistances are waiting for the XMR price at around $ 153.5 and $ 162.
Without a break in the golden Ratio at around $162, the correction remains intact and XMR could possibly move even lower. However, the MACD gives rather bullish signs in the daily chart, because the histogram has been ticking bullish higher for a few days. However, the MACD lines still remain bearish crossed and the RSI gives neither bullish nor bearish signals.
Weekly MACD is clearly bullish
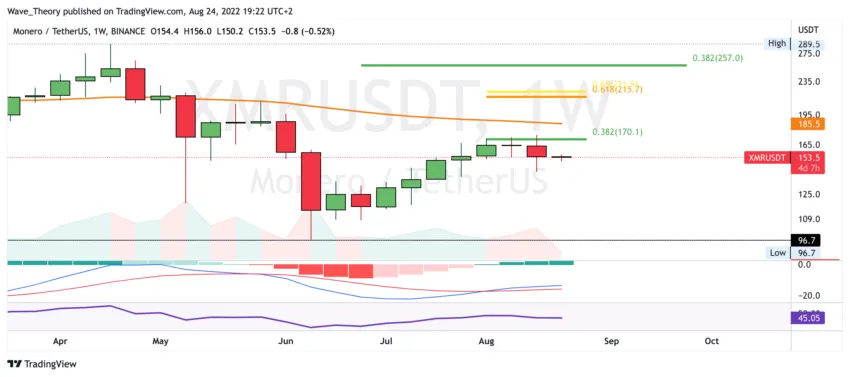
On the weekly chart, it looks like a bearish rejection at the 0.382 Fib level at around $ 170. The 50-week EMA at around $185.5 remained untouched in the last upward movement. However, this must be broken in order for the XMR rate to have a chance of reaching the Golden Ratio resistance at around $ 220.
In fact, the XMR price was last above the 50-month EMA in May of this year. However, if the XMR price bounces bullish at the Golden Ratio at around 125 USD at the latest, there are still chances of a break of the 50-month EMA resistance.
Finally, the MACD is clearly bullish on the weekly chart. Because the MACD lines are crossed bullish and the histogram has been ticking bullish higher for weeks. The RSI is also neutral here.
The histogram of the MACD ticks bullish higher in the monthly chart
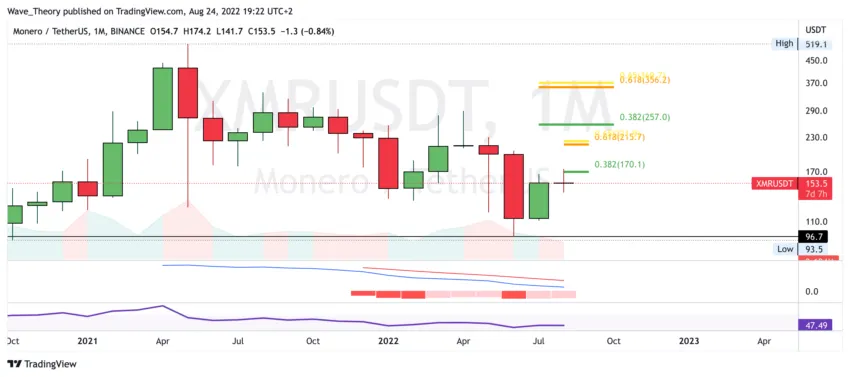
The RSI is also neutral on the monthly chart. However, the histogram of the MACD also ticks bullish higher here. However, the MACD lines remain bearishly crossed.
For a bullish trend reversal, with chances of a new ATH, the Monero price must first break the Golden Ratio resistance at around $ 360.
Against BTC, the Monero price was able to break the bearish trend line bullish
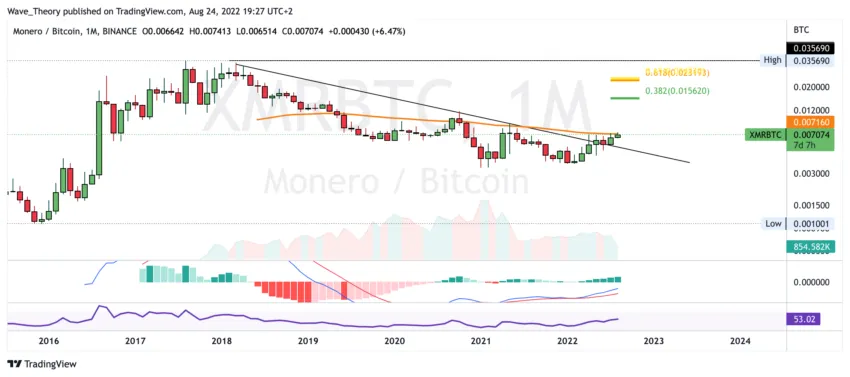
Against BTC, the MACD is clearly bullish on the monthly chart, because the histogram has been ticking bullish higher for several months and the MACD lines are also crossed bullish. The RSI is also neutral here.
In addition, the XMR price was able to break the bearish trend line that connects the high points of the last four years. While this is extremely bullish for the XMR/BTC price, the XMR price is now at decisive resistance. Because the XMR price is currently encountering significant resistance at the 50-month EMA at around 0.00716 BTC.
For a bullish trend reversal and chances of a new ATH, the XMR price must break the Golden Ratio at around 0.0232 BTC.
XMR price is in a parallel upward channel against BTC
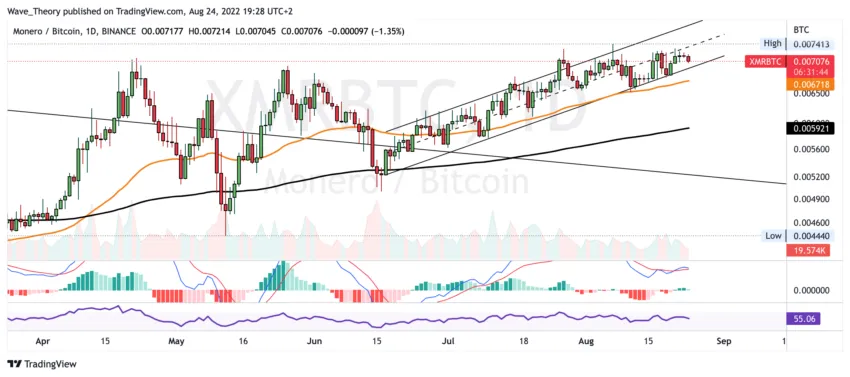
In the daily chart, the MACD lines are on the verge of a bearish crossover and the histogram of the MACD is also ticking bearishly lower today. Furthermore, the Monero price in a parallel upward channel, since Monero last bounced off the 200-day EMA in mid-June. Since then, the 50-Day EMA at around 0.0067 BTC as support.
Otherwise, Monero finds significant support at around 0.0059 BTC on the 200-day EMA.
Disclaimer
All information contained on our website is researched to the best of our knowledge and belief. The journalistic articles are for general information purposes only. Any action taken by the reader on the basis of the information found on our website is done exclusively at his own risk.


